Early Warning Maps: Predicted Nutrition Severity in Fragile and Conflict-Affected Contexts

UNICEF Use Case

As part of the project, Sudan has been selected as the primary use case, with analysis focused on the country’s populated southern regions. Recent reports from the Integrated Food Security Phase Classification (IPC) indicate that 24.6 million people, nearly half of Sudan’s population, are currently facing high levels of acute food insecurity.

This deterioration reflects the combined impacts of ongoing conflict, large-scale displacement, severe economic decline, collapse of essential services and significant constraints on humanitarian access.

Within this context, Smart Connect’s outputs, such as the Severity Nutrition Index (SNI) maps, offer valuable insights into evolving nutrition emergencies, even in areas that remain highly insecure or inaccessible to field teams. The Sudan case study also demonstrates how the system can be scaled and applied to other crisis-prone settings worldwide.

Description

The main strength of this approach lies in its innovative risk-based methodology, which can integrate large amounts of data from diverse sources to represent the key drivers and factors influencing nutritional conditions, especially in contexts where regular nutrition assessments are sparse or delayed.

The model is organized into four domain modules: Climate & Environmental, Socio-Economic, Conflicts & Displacement, and Health & Nutrition, each implemented through a multi-dimensional structure. For example, the Climate & Environmental module relies on three dimensions: agriculture, livestock and water availability. For each dimension, the model calculates (1) a main factor representing the underlying condition, (2) an impact factor describing stressors, (3) a temporal component capturing the lingering effects of previous months, and (4) a dynamic weight that adjusts according to emerging conditions. This hierarchical and modular structure provides a tailored assessment for each domain, maintains internal coherence while adapting to data availability and regional dynamics, and can be scaled and replicated in other contexts.

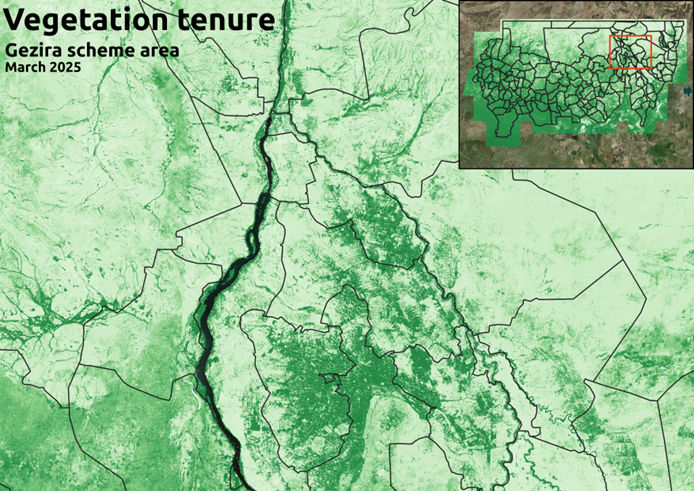
Figure 1: For the agriculture and pastures dimensions, EO data from Sentinel-2 mission are used to assess the vegetation tenure of croplands and pastures. This information is further combined with other environmental as well as socio-economic information and is used in the Index modeling.

The robustness of the approach is reflected in its use of reliable and accessible datasets, demonstrating how Earth Observation products can be effectively combined with socio-economic, conflict, health and basic nutrition data to produce simple 0–1 score at subnational level, where higher values indicate worse conditions. These scores can be updated monthly and used for near-real-time monitoring and short-term forecasting of nutrition risk, complementing existing, survey-based nutrition assessments rather than replacing them.

Results
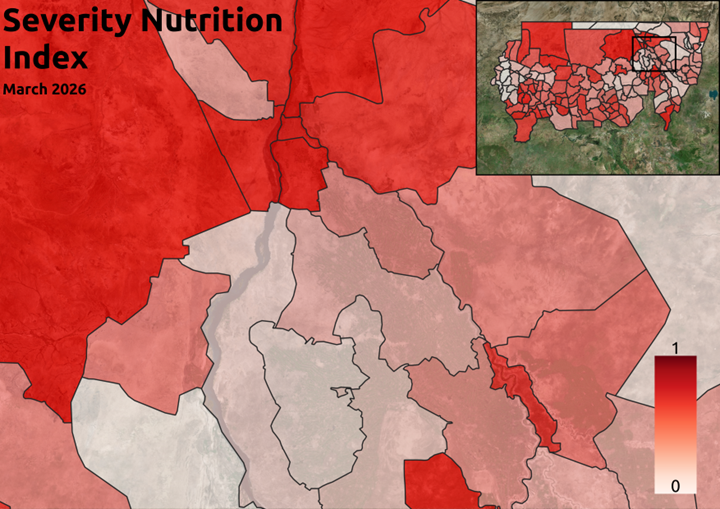
Outputs are generated monthly and include six consecutive one-month-ahead forecasts. At each time step, the Severity Nutrition Index (SNI) is calculated at administrative level 2 for every subnational unit as a composite 0–1 score that summaries overall nutrition risk. This score is derived from the four contributing modules: climate and environment, socio-economic, conflict and displacement, and health and nutrition. These are also provided separately to give a transparent view of the underlying drivers. The results are visualized through admin 2–level colour maps and distributed via OGC-compliant services, making them easy to integrate into existing UNICEF workflows and geospatial dashboards.
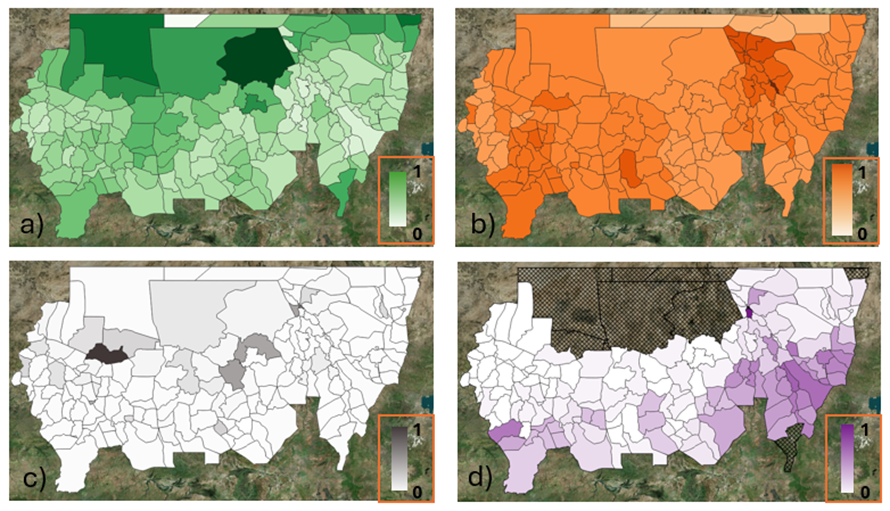
Figure 2: For each domain module a 0 to 1 map is generated where higher values represent worst conditions. The images are estimations for November 2025.  a) Climate & Environmental,  b) Socio-Economic, c) Conflicts & Displacement, d) Health & Nutrition.
Figure 3:The final output consists of the Severity Nutrition Index map, which assigns to each administrative unit a value between 0 to 1 where higher values, therefore a more intense red, represent worse nutrition conditions. The image shows the SNI map estimated for March 2026.

The SNI has demonstrated its ability to highlight emerging malnutrition risk zones with sufficient lead time to inform early action and guide targeted assessments.

Validation against available food security and nutrition datasets confirms its value as a relative early-warning measure, while recognizing that it is not an absolute prevalence indicator due to persistent data gaps and spatial inconsistencies.

Despite these limitations, the Index offers a systematic, data-driven approach for monitoring nutrition risk in fragile and conflict-affected contexts and is designed to complement, rather than replace, existing analytical products and situation reports.